

TFG3900A as a dual channels function/arbitrary waveform generator, can generate a maximum 160MHz signal to meet the engineer's measuring requirement. It can be operated not only by the front panel but also by remote interface: USB Host and USB Device, LAN. For some standard and easy waveforms, you can use the front panel to edit directly, but for some complicated waveforms, it is better to use ArbEditor software to edit on the computer through LAN interface. In the User's Guide and Programmer Guide, there is a detailed introduction about it. Please refer to it when you need this function.
Here I'd like to introduce the remote operation of arbitrary waveform editing on TFG3900A. Take examples of short waveform transferring and long waveform transferring.
Before the operation, please make sure to install the latest version ArbEditor software on your computer.
In the ArbEditor, you can create and edit Arbitrary waveforms with the edit options covering free drawing, horizontal drawing, vertical drawing, mirror image, compressing, copying, and pasting. After setting the relevant parameters of the waveform such as amplitude, offset, period, etc., and previewing it on the computer, you can send or download it to the instrument. The TFG3900A will receive the waveform remotely, then it can be displayed in the oscilloscope.
We take some pictures of the long waveform and short waveform transferring, please see them below:
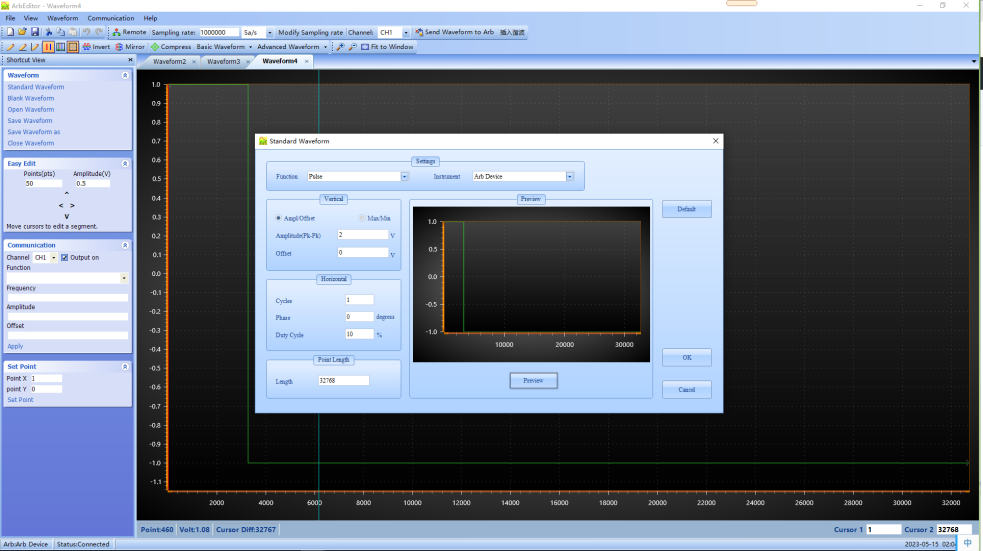
Long waveform setting
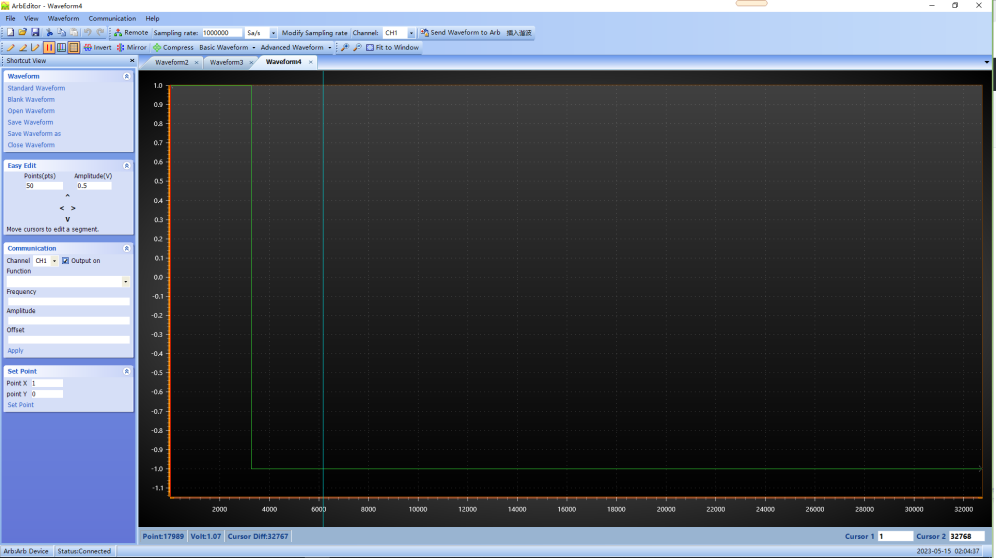
Preview of long waveform setting
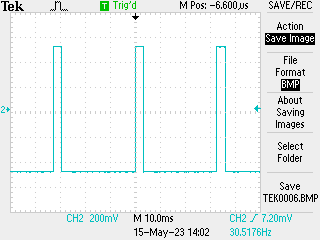
Long waveform displaying in oscilloscope
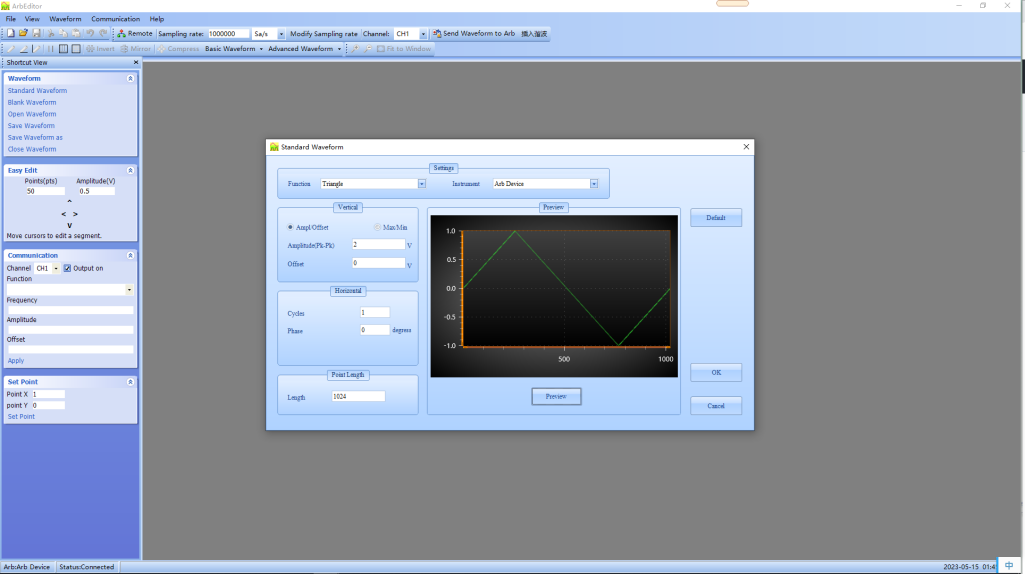
Short waveform setting
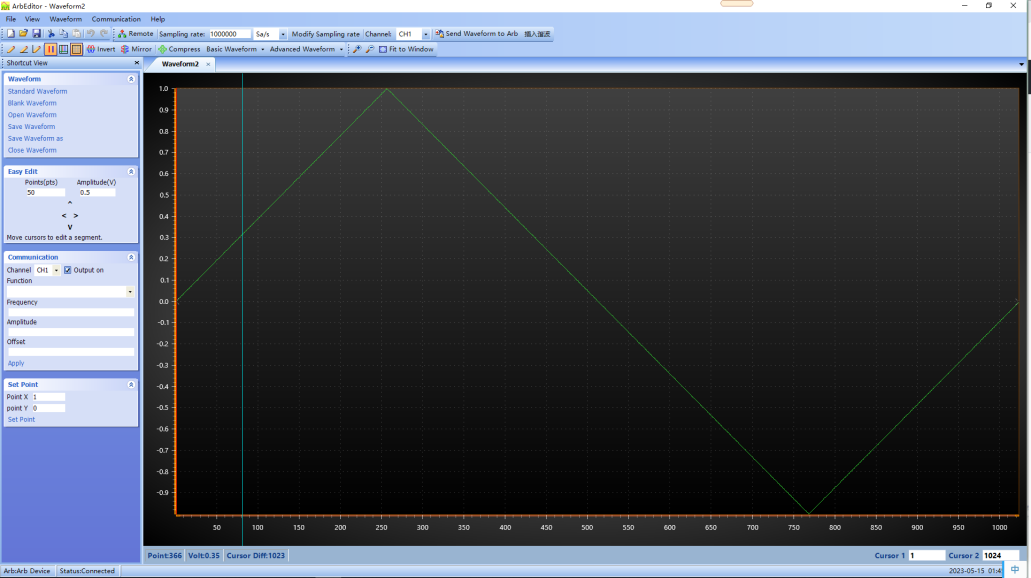
Preview of short waveform
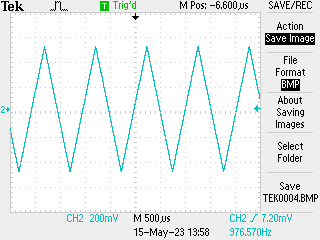
Short waveform displaying in oscilloscope
Welcome to contact us for buying it.
Dec. 19, 2025
Differences Between Function Generators, Arbitrary Function Generators, and Arbitrary Waveform GeneratorsNov. 18, 2025
Uses and Benefits of Programmable Power SuppliesNov. 07, 2025
Suin at 11th Feria FISE 2025 in Colombia